Perhaps you’ve stumbled on the term buy wall or sell wall before when you traded stocks or crypto, but you haven’t quite grasped the meaning of the terms. Buy or sell walls, sometimes known as bid or ask walls, are actually a very simple concept which can help you make better decisions when placing orders.
Let’s dig deeper to understand what they are, so you can spot these buy or sell walls to make better trading decisions.
1. What is Order Book?
First, you need to understand the concept of order book.
An order book is an electronic list of buy and sell orders for a specific security or financial instrument, organised by price level. An order book lists the number of shares being bid or offered at each price point, or market depth.
When orders on either side of the book match at a certain price point, a trade is made, and the price of the instrument is set – supply meets demand. If orders on both buy and sell side don’t match, orders sit in the order book unfulfilled until another order comes in that matches the price.
However, orders don’t skip past one another – they are fulfilled in the sequence of the price.
Here is an example:
When Bob is trying to sell a single BTC for $6100, and Alice is trying to buy 1 BTC at $6000, those two orders will sit unfulfilled. Suppose Carol comes in and tries to sell one more BTC at $6200, there will be three unfulfilled orders because neither of them meet at the price.
When a desperate buyer (Chuck) comes into the market and proposes to buy one BTC at $6200, he does not actually get Carol’s coin; he receives Bob’s BTC ($6100), and the price of BTC is determined to be $6100. Alice’s and Carol’s order will remain in the book.
2. What is Market Depth Chart?
Most trading platforms give you a raw list of orders in the order book. To better visualise these unfulfilled orders, they also give you the market depth chart, which looks like this:
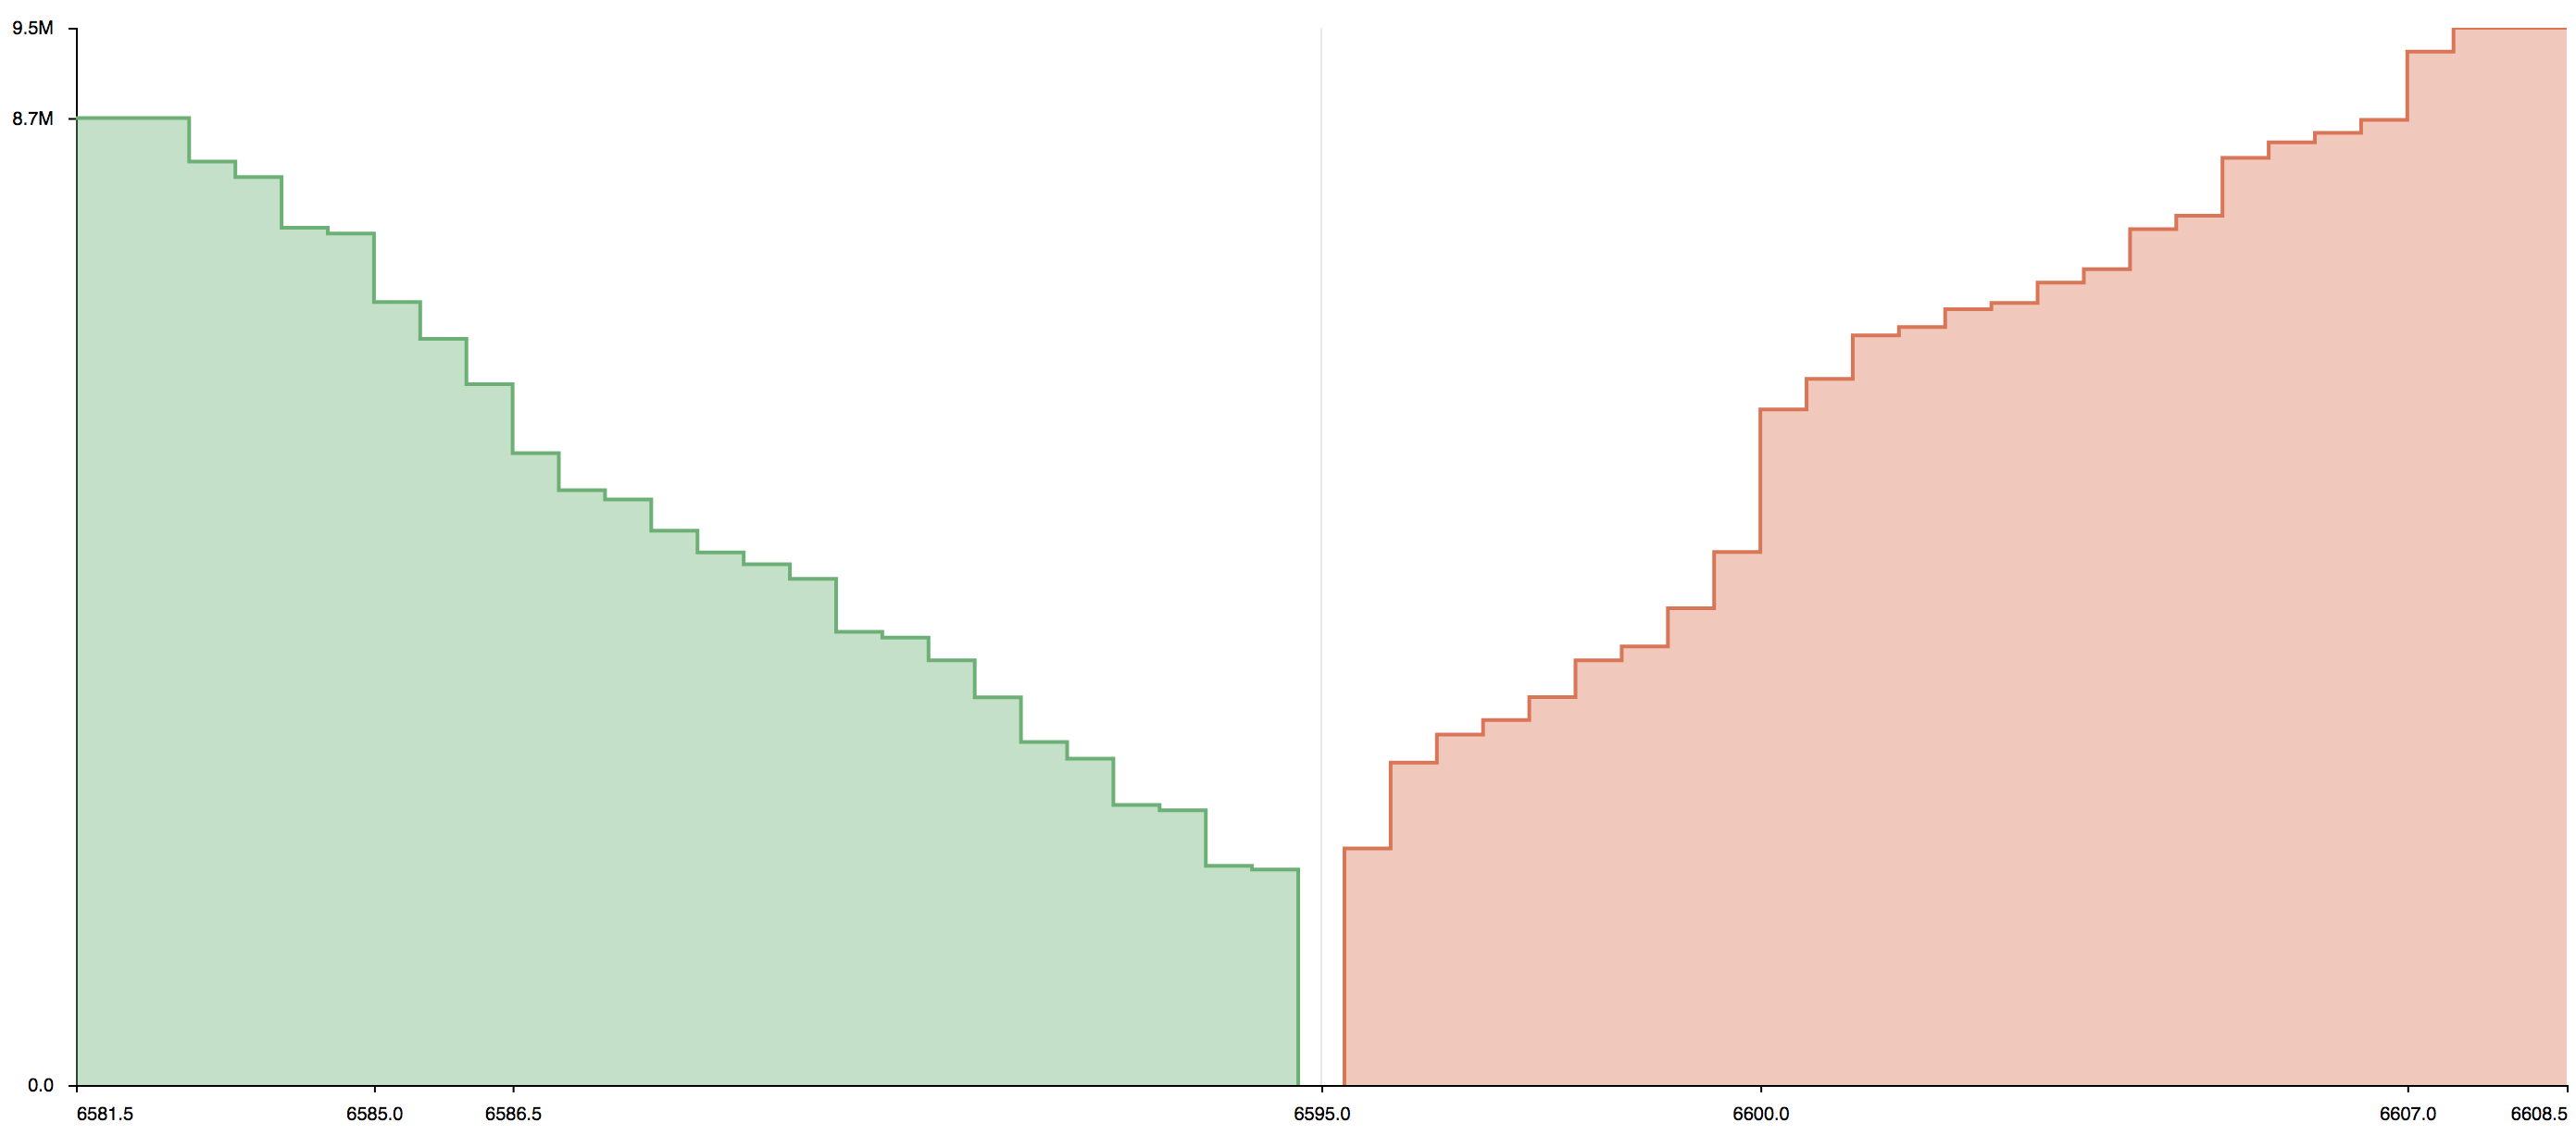
When you graph the price point at which the bid/ask is placed on the X axis, and a cumulative volume of orders on the Y axis, you get the market depth chart. Market Depth chart gives a quick overview of the market sentiment and how people feel about different price points of the instrument.
You can read more about market depth on Investopedia.
3. Understanding the Stock Wall (Buy or Sell Wall)
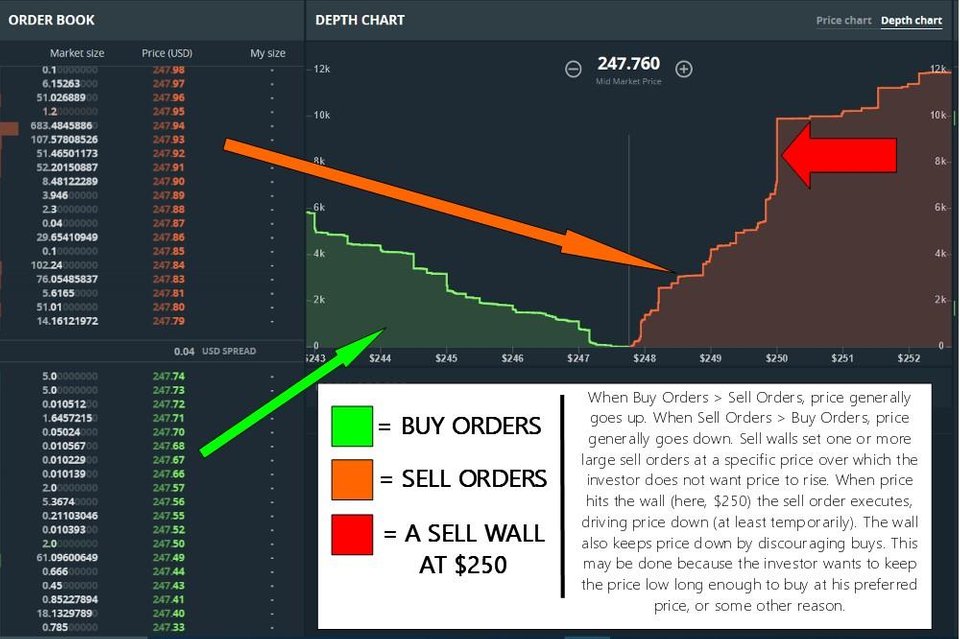
When you see a disproportionately large spike sloping upwards on either side of the market depth chart, you call this a buy or sell wall.
This is called a buy or sell wall because (surprise, surprise) it resemble a wall. Remember the part about sequentially selling the orders based on the price? If the wall is big enough, it could hold the same price for quite some time. You will have to “eat into the wall”, so to speak, before the price of the instrument can change.
Why do these buy and sell walls appear, you say? Sometimes they are accidental, and other times intentional.
Accidental buy or sell walls may be due to psychological barrier set by a number of traders. Suppose you buy BTC at $6000 and aim to sell it at $6200, you would put in a sell order at $6200. If enough people do the same, unfulfilled orders can accumulate to form a wall. There is something about round numbers that set a barrier in our mind.
When walls are intentional, most likely it is put there by a whale (someone with large sums of money), aiming to manipulate the price of an instrument to their benefit.
It is hard to tell when these walls are accidental or intentional. So, be mindful of them and make sure to place smart orders.
4. Ready to trade?
So, you are ready to trade. You must be looking for a platform to trade on. My personal choice is Bitmex because it has a good mix of coins paired with futures. Bitmex is one of the pioneers in online crypto trading - the OG of 100x leveraged crypto trading. Click here to sign up for Bitmex to get 10% off your trading fees for 6 months.